Related Images


Download:
| Tiny | 274x128 | View | Download |
| Original png | 540x252 | View | Download |
| Original as jpg | 540x252 | View | Download |
This image was acquired from
wikimedia. It was marked as Public Domain or CC0 and is free to use. To verify, go to the source and check the information there.
Looking for more info about this image?
Try a Google Reverse Image Search for it.
Try a Google Reverse Image Search for it.
Keywords from Image Description:
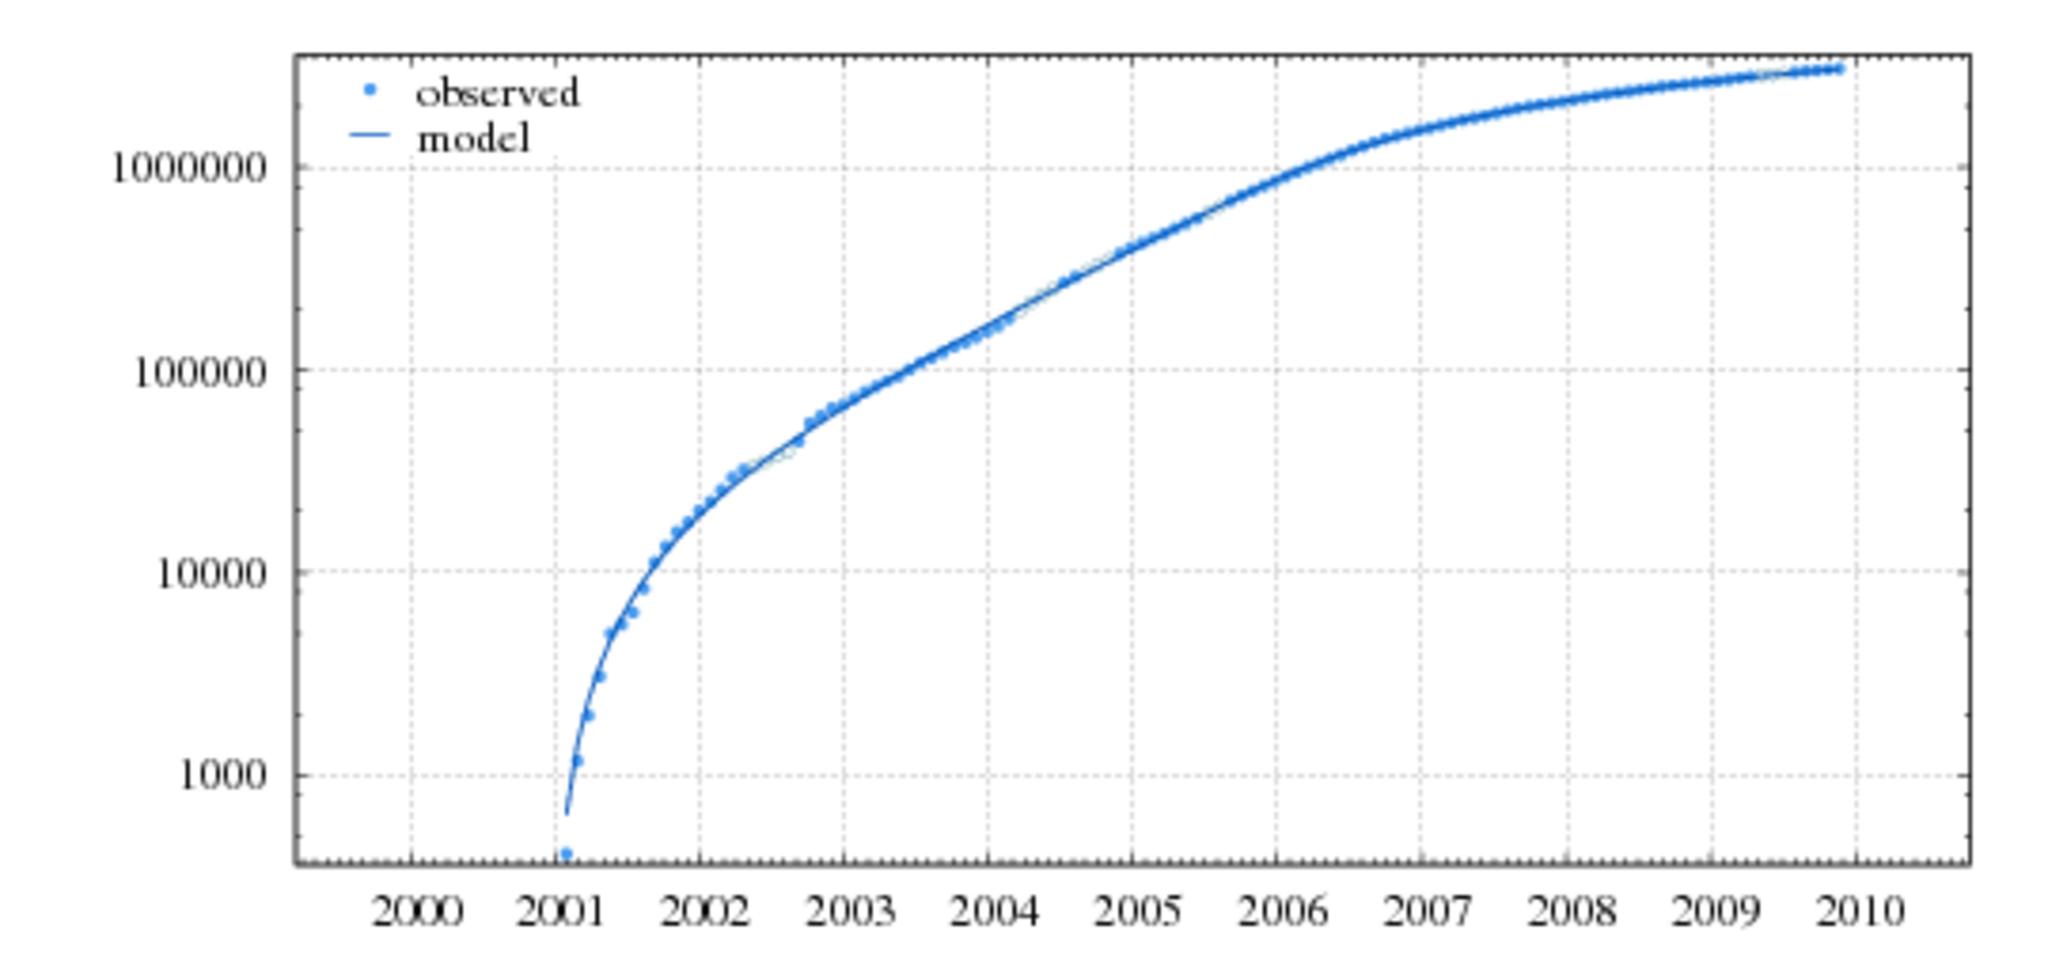
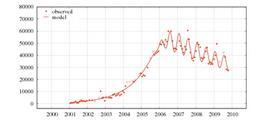
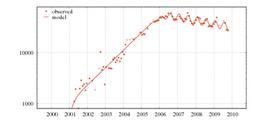
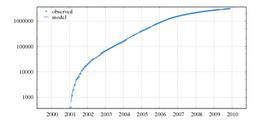
Wpsizeirrprdpsszey. en twophase model for the article count The dots are observed values obtained by interpolating the official article count data The solid line is the model This version ignore the seasonal modulation LOGSCALE PLOT own Jorge Stolfi English statistics