
Related Images


Download:
| Tiny | 128x128 | View | Download |
| Small | 256x256 | View | Download |
| Medium | 513x512 | View | Download |
| Original png | 984x982 | View | Download |
| Original as jpg | 984x982 | View | Download |
This image was acquired from
wikimedia. It was marked as Public Domain or CC0 and is free to use. To verify, go to the source and check the information there.
Looking for more info about this image?
Try a Google Reverse Image Search for it.
Try a Google Reverse Image Search for it.
Keywords from Image Description:
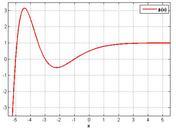
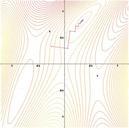
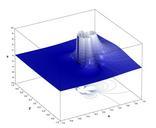
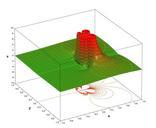
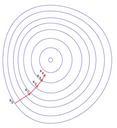
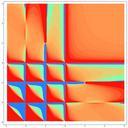
Beta function contour plot. Created with Sage en contour plot of the beta function Created using the following Sage code from math import isnan from scipy import stats def beta return gamma gamma gamma vals beta for in srange for in srange test values to work out contours filtered filter lambda num not isnan num and num