Related Images


Download:
| Tiny | 169x128 | View | Download |
| Small | 338x256 | View | Download |
| Original png | 412x312 | View | Download |
| Original as jpg | 412x312 | View | Download |
This image was acquired from
wikimedia. It was marked as Public Domain or CC0 and is free to use. To verify, go to the source and check the information there.
Looking for more info about this image?
Try a Google Reverse Image Search for it.
Try a Google Reverse Image Search for it.
Keywords from Image Description:
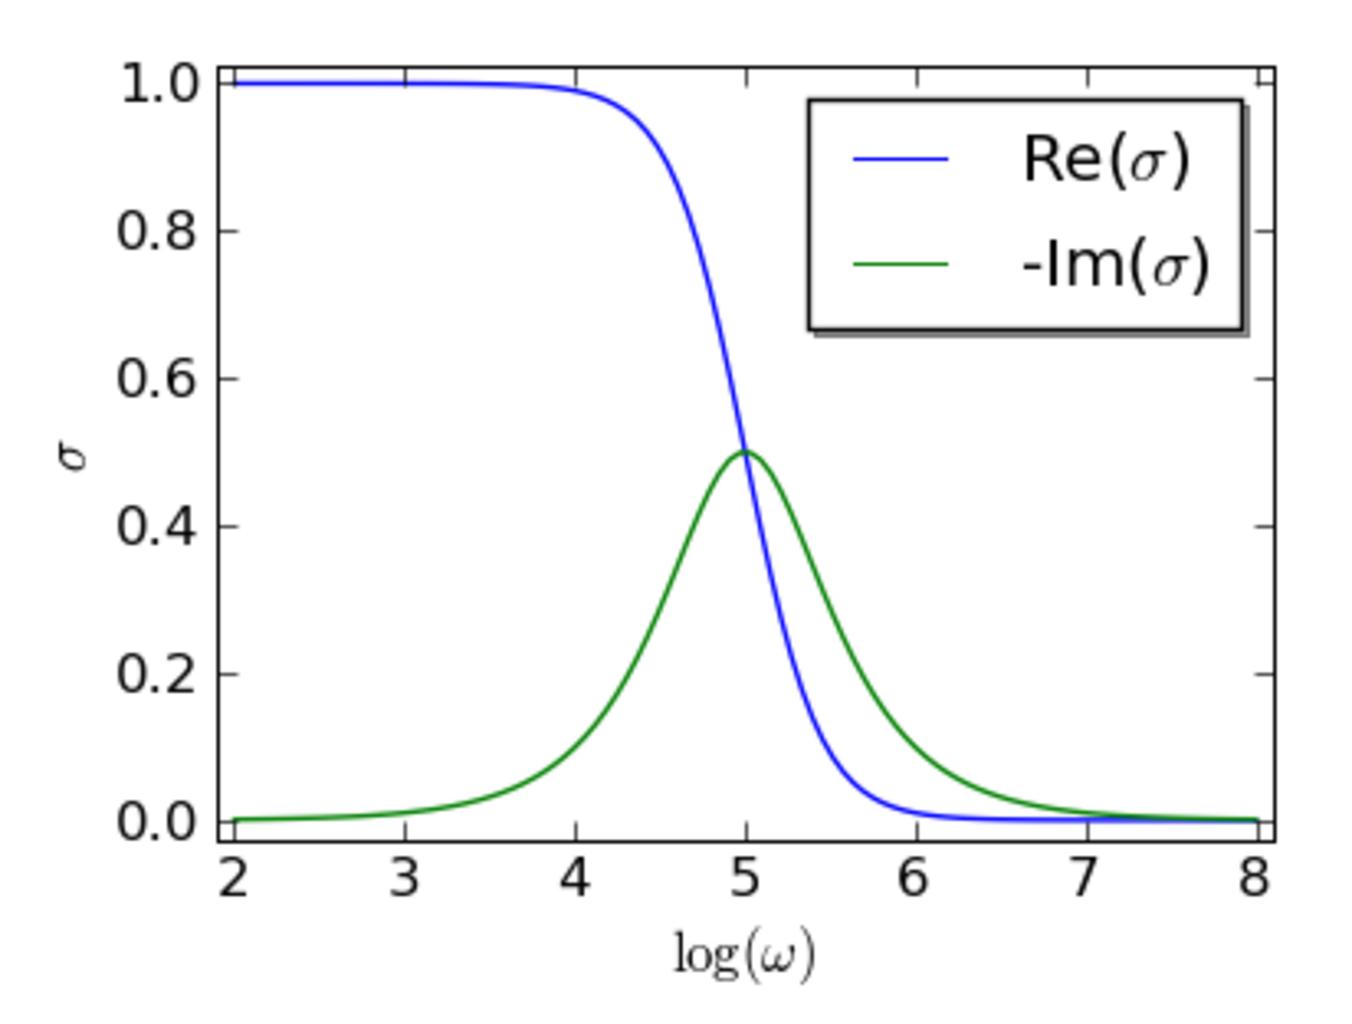
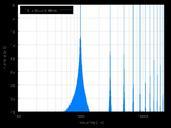
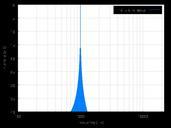
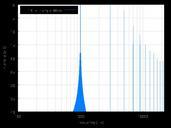
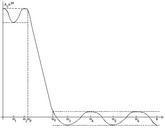
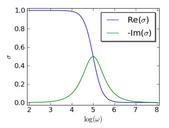
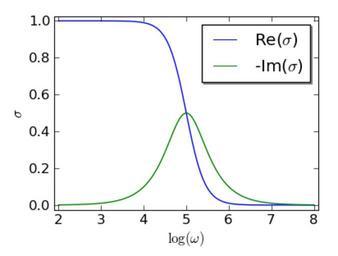
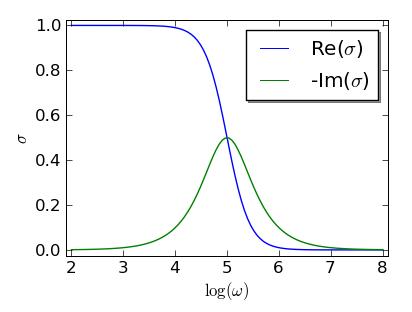
DrudeModelComplexConductivity. en An illustrative graph of the complex conductivity with log frequency on the xaxis selfmade using python pylab and numpy September UTC Glenton Jelbert Grj talk using python pylab and numpy Created with Matplotlib cczero Physics graphs Metal physics