This image was acquired from
wikimedia. It was marked as Public Domain or CC0 and is free to use. To verify, go to the source and check the information there.
Looking for more info about this image?
Try a Google Reverse Image Search for it.
Try a Google Reverse Image Search for it.
Keywords from Image Description:
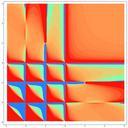
Gjlcmap. color map illustrating Visualising Complex Functions Own GeorgJohann Lay The values indexed saturation control the transition saturated colors white resp gray scale intermediate values infinity The values indexed value control the transition black bright zero nonzero Parameter controls where the transition takes place is


