
Related Images


Download:
| Tiny | 196x128 | View | Download |
| Small | 393x256 | View | Download |
| Medium | 786x512 | View | Download |
| Original png | 1276x831 | View | Download |
| Original as jpg | 1276x831 | View | Download |
This image was acquired from
wikimedia. It was marked as Public Domain or CC0 and is free to use. To verify, go to the source and check the information there.
Looking for more info about this image?
Try a Google Reverse Image Search for it.
Try a Google Reverse Image Search for it.
Keywords from Image Description:
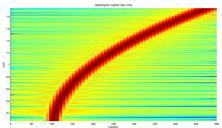
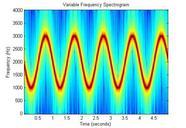
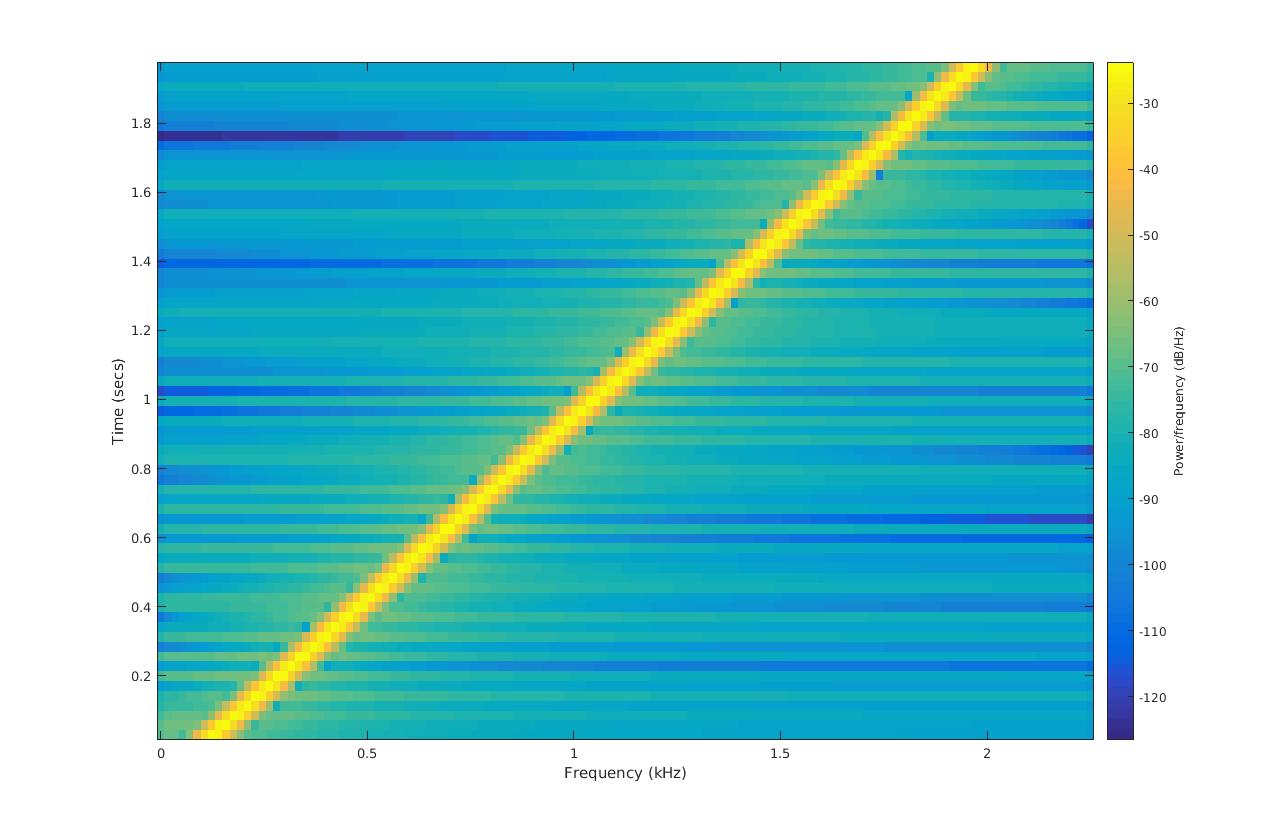
LinearChirpMatlab. en Spectrogram of linear chirp The spectrogram plot demonstrates the linear rate of change in frequency as function of time in this case from to kHz over the course of seconds The intensity of the plot is proportional to the energy content in the signal at the indicated frequency and time own Mark Stenglein