Related Images
Download:
| Tiny | 170x128 | View | Download |
| Small | 341x256 | View | Download |
| Medium | 683x512 | View | Download |
| Original svg | 688x515 | View | Download |
| Original as jpg | 688x515 | View | Download |
This image was acquired from
wikimedia. It was marked as Public Domain or CC0 and is free to use. To verify, go to the source and check the information there.
Looking for more info about this image?
Try a Google Reverse Image Search for it.
Try a Google Reverse Image Search for it.
Keywords from Image Description:
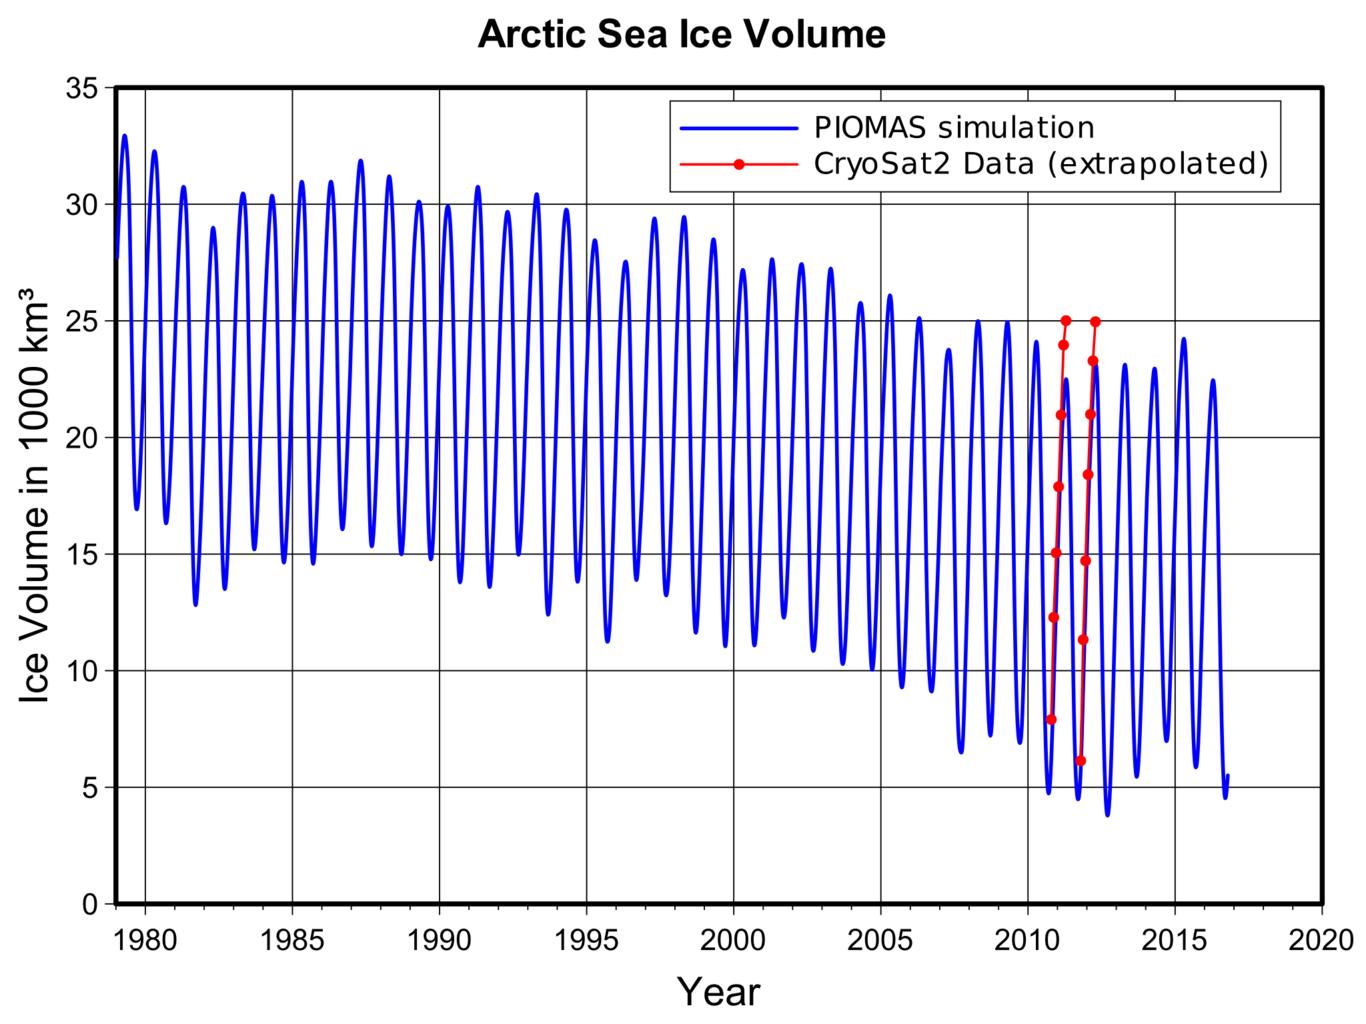
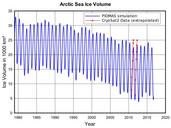
Plot arctic sea ice volume.svg sea ice volume between and now Blue curve are data as determined by the numerical model PIOMAS An error margin of km is given for october single values minima as orientation Red dots are data from an analysis of CryoSat radar freeboard measurements Their single point uncertainty is in the range