
Related Images


This image was acquired from
wikimedia. It was marked as Public Domain or CC0 and is free to use. To verify, go to the source and check the information there.
Looking for more info about this image?
Try a Google Reverse Image Search for it.
Try a Google Reverse Image Search for it.
Keywords from Image Description:
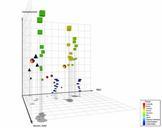
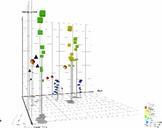
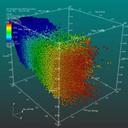
Scatter plot. en Scatter plot VisIt's Scatter plot allows for the visualization of multivariate data of up to four dimensions The Scatter plot takes multiple scalar variables and uses them for different axes in phase space The different variables are combined to form coordinates in the phase space and they are displayed using glyphs