
Related Images


This image was acquired from
wikimedia. It was marked as Public Domain or CC0 and is free to use. To verify, go to the source and check the information there.
Looking for more info about this image?
Try a Google Reverse Image Search for it.
Try a Google Reverse Image Search for it.
Keywords from Image Description:
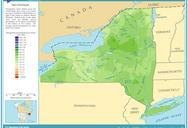
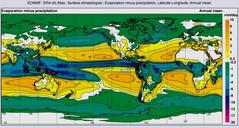
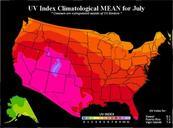
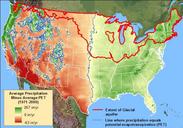
United States Average Precipitation Minus Average Potential Evapotranspiration. en Map showing gridded values of average precipitation minus average potential evapotranspiration PET precipitation and PET estimates from McCabe and Wolock The blue lines indicates zero where average precipitation equals PET PET exceeds average precipitation