
Related Images

Download:
| Tiny | 197x128 | View | Download |
| Small | 395x256 | View | Download |
| Original png | 664x430 | View | Download |
| Original as jpg | 664x430 | View | Download |
This image was acquired from
wikimedia. It was marked as Public Domain or CC0 and is free to use. To verify, go to the source and check the information there.
Looking for more info about this image?
Try a Google Reverse Image Search for it.
Try a Google Reverse Image Search for it.
Keywords from Image Description:
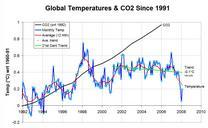
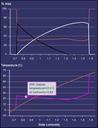
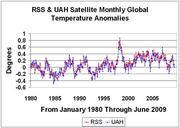
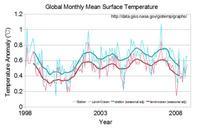
GlobalMonthlyMeanSurfaceTemperature. en This plot shows global monthly landocean surface temperature change in the latest decade The red line is change observed under meteorological stations and the blue one is the temperature index which includes sea surface temperature obtained from satellite measurements The bold lines are the